After more than 15 years of planning, pitfalls, and political football-pulling, congestion pricing finally hit New York City last week, in the form of the new Congestion Relief Zone Toll (CRZT). Though the data won’t be conclusive for some time (if ever?), heated opinions are swirling, questions of federalism and interstate commerce still abound, and at least ten legal challenges are working their way through the courts.
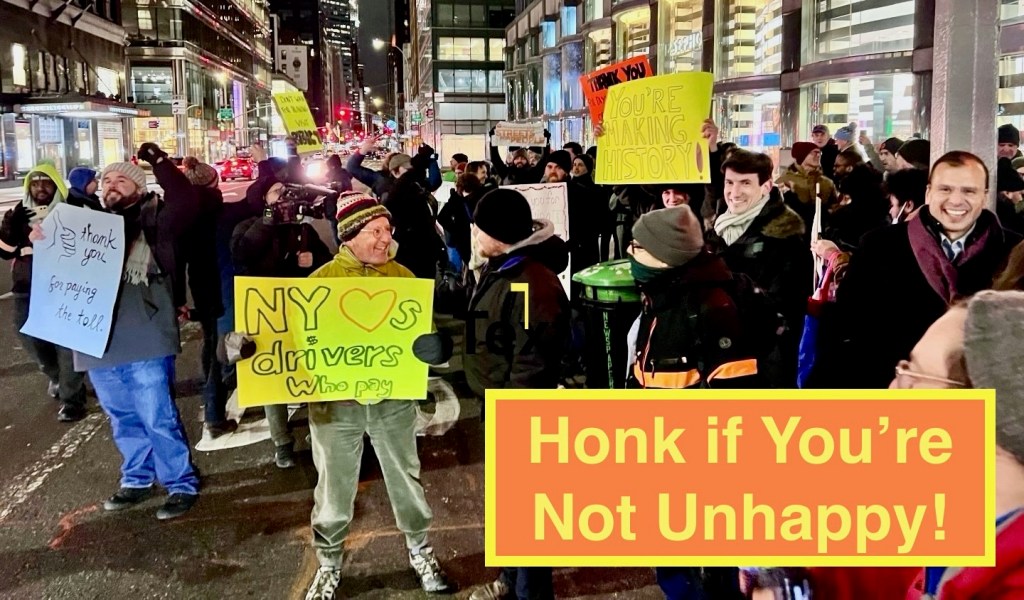
Ecstatic about reduced externalities (photo by Sproule Love, featuring Streetsblog author Charles Komanoff and other toll boosters)
But even if we can’t predict the fate of congestion pricing in NYC, it’s a great time to speculate on the impacts it could have on NYC’s commercial real estate.
The Flight to Quality – Welcome to the NYC Drivers Club
By improving NYC’s streets, congestion pricing could add value and “quality of life” to a wide array of commercial properties, not just Class A. But the added fees will likely cause employees in the southern-Manhattan Central Business District (the CBD) to set new routines or head to HR with new demands.
The “Flight to Quality” refers to the growing tendency of investors, tenants and other consumers to favor higher-end, typically more amenity-rich, Class A properties over others. This trend is spurred by a range of factors, from recruiting competition, to health and safety concerns lingering from COVID-19. If congestion pricing improves streets across the City, the results could form a public amenity and a selling point for commercial properties that were previously plagued by debilitating rush hours. Decision-makers who would gladly pay $9 for a commute to their new office may find this particularly persuasive.
On the other hand, regardless of how effective the new tolls are in improving the commutes and making the City more “livable,” it is undeniable that the toll is yet another fee (ranging from $0.75 on taxis, to $32.40 for trucks during peak hours, per MTA‘s latest chart below) on the already-pricey cost of life in NYC. That alone will cause some residents and commuters to change habits, and possibly their jobs, not to mention new transport and delivery routes. This disruption is poised to cause headaches for logistics teams and human resources departments across the City and beyond.

Billboards vs. Drivers’ Attention Spans
Owners of billboards and other “outdoor advertising” that have grown accustomed to slow vehicular speeds will have to adjust. Stuck in traffic, outdoor advertisers could rely on longer dwell times by commuters (aka “eyes on ad” time), and adjust rates accordingly. Decreasing dwell times could mean a reduction in value for an industry that has faced a steady decline the last five years (approx. 30% during peak COVID, and 5% declines the last two years, by some estimates). With commuters passing by at quicker speeds, and pedestrians not likely to look up from their phones anytime soon, outdoor advertising in the CRZ will face even more pressure to compete for attention (e.g., brighter signs, digital carousels), or renegotiate pricing altogether.
More Workouts into Work?
As an avid bike commuter, myself, I feel a bit removed from the immediate impacts of the new tolls. However, I selfishly hope the program leads to more bike commuters (safety in numbers) and improved bike lanes. It also stands to reason that congestion pricing may reduce a notoriously dangerous element of urban cycling: the frustrated driver. With fewer cars on the road, and with it less road rage, more commuters may turn to cycling, jogging, or other cardio-friendly commutes.
This would be a trend over 20 years in the making, with an outlier dip during COVID (see chart below from NYC DOT). Bike ridership increased steadily over the last 4 years in NYC, with each of the East River crossings experiencing record numbers of bikers, including an overall 8.4% increase in 2024 alone. Not to mention the occasional jogger, roller-blader or other self-propelled commuter.
To fully compete for tenants, office properties in the CRZ should consider improving all transportation-alternative amenities, including bike storage and locker rooms, to satisfy employees who choose to get a workout on their way to work.

A Non-Exhaustive (sorry) list of Potential Impacts from Congestion Pricing on NYC Commercial Real Estate:
- Potential marketing benefit for some CRE owners and employers, resulting from improved urban experience and more dependable logistics.
- Human resource and operational challenges for impacted businesses, such as requests for reimbursements on the new tolls, amendments to pre-tax spending accounts, especially for businesses with new return-to-office (RTO) requirements.
- Potential conversions of less-active parking lots into more profitable uses or short-term activations (eg, film shoots, temporary storage, etc.).
- Increased number of cyclists, bike-share users, joggers, etc …, prompting new and improved bike storage and shower amenities.
- Advertisers’ reevaluation of NYC “out-of-home” advertising properties (e.g. billboards vs subway walls), following commuter traffic pattern changes.
- New and possibly disruptive evening traffic flows and delivery routes, with related noise and safety concerns.
- New measurement tools and graphic information about the impacts of congestion pricing on real estate, with new opportunities for the prop-tech market.
- New car-sharing and car-pooling trends or tools (Via’s big break?).
- New opportunities for pedestrian plazas or commercial sidewalk sheds.
While prognosticating is, now is also a good time to pump our brakes a moment and recognize the CRZT for what it is …
A Big Deal. But too soon to Celebrate?
Notwithstanding any of the improvements or disruption to NYC life, this week’s roll-out of the CRZT is a major landmark moment, and one of the boldest experiments conducted in any American metropolis.
Administered by the state-controlled Metropolitan Transit Authority, with key support from the Federal Highway Administration and NYC Dept of Transportation, the CRZT aims to produce a virtuous feedback loop of reducing congestion while also improving mass transit. Charge vehicles for their collective impact on the city, reduce traffic, fund public transit infrastructure, boost quality of life, and repeat until congestion subsides.
Historic and momentous, right? So, why isn’t everyone in NYC cheering it on (other than the transportation-alternatives superfans pictured above – bless them!)? Why are former Bloomberg officials starting a Mission Accomplished victory lap before the results are in, and two administrations later? And why so much hand-wringing about why congestion could be overturned by the courts or unwound by incoming President Trump?
All for the same reason – the CRZT struggled for over 15 years to get a greenlight, it relies vulnerably on a complex array of agreements between nearly every layer of government (plus independent authorities and review boards), and faces a number of powerful opponents and viable legal challenges.
The CRZT is proof that our federal system can cooperate to get big things done, it’s not guaranteed to endure. As with any novel legislation that imposes a hefty fee, or potentially impacts interstate commerce, there are numerous legal theories that can be used to invalidate it. If successful, the CRZT will become a mainstay of modern urban life, on par with vibrant waterfront revitalizations, mixed-use conversions of industrial zones, and the 2004 public smoking ban by the Bloomberg administration. If unsuccessful, congestion pricing could join the ranks of too-lofty or too-tenuous tax schemes, like Seattle’s $275-per-office-employee office tax of 2018 intended to fight homelessness, or Bloomberg’s large beverage tax meant to fight the obesity epidemic.
So, for congestion-pricing fans, or those who think the MTA is at least on the right track, a premature celebration seems sensible, especially in light of how impossible this mission seemed in the first place. But with the data still raw, and experts and agencies all over the place on how the data should be measured in the first place, not to mention divisive issues of social equity and urban justice, don’t expect an all-out victory parade anytime soon.
Mark D. Jackson
(published as a LinkedIn Article on Jan 13, 2025, with updates below)
Ongoing Updates to NYC Congestion Pricing:
January 13, 2025 (Monday evening after Week 1) – MTA’s data:
MTA published this press release and a snapshot of week 1 data answer the following questions:
- Q1. How is the program changing the number of vehicles entering the CBD?
- Q2. Are driving times improved in and to the CBD?
- Q3. Are bus riders seeing trip time improvements?
- Q4. Has the program changed transit ridership?
… including the following charts answering Q2:


… and this Week 1 summary:

Jan 23, 2025 (Thursday evening of Week 3) – Congestion-Pricing-Tracker and $9 Restaurant Deals
You might have read about this data-rich interactive website, which uses Google Maps data to show the impacts of Congestion Pricing along 19 different routes in and out of the Congestion Relief Zone.
This site has become an official resource for Congestion Pricing watchers, and has an unlikely sponsor in Emily Oster. If that name is familiar, you likely became a parent within the last decade and have read one her best-selling books on the data of parenting (Expecting Better, Cribsheet, the Family Firm). According to a story by the Verge about the CP tracker, this project came into existence when Professor Oster convinced one of her students at Brown, Benjamin Moses, to pause his study on taxis and look at Congestion Pricing instead. He somehow got his brother Josh involved, further up the I-95 corridor at Northeastern University, and the rest has been history. Hats off to this team for creating a simple and useful tool to help study the mind-boggling data frenzy that is Congestion Pricing.
Their charts, according to the website, show the results of traffic data from Google Maps using the “shortest time to drive from Point A to Point B for every route” with “data points every 15 minutes for every route, resulting in 1824 data points a day.”
For instance:

Another bright spot in the Congestion Pricing soap opera has been the flurry of restaurant promotions. When cash-strapped drivers felt the pinch, these $9 deals were here to help. There has got to be a Congestion Heart Failure joke in here somewhere. Please let me know if you find it.


Leave a Reply